
NET SECURITY | All | Use Now
What does it do?
The reason i build this app because i'm curious what is going in and out of my desktop computer, laptop/tablet or and of my Windows platform based devices when they go online. Lots of unknown pesky agent, bots, spyware, malware, hacker or mining bot (like bit-coin thingy) going in your/my computer probably downloading or peeking stuff without permission. Even 'legit sofware can do nasty stuff like sending telemetry data about what you do on your computer/devices and send back to HQ. So i build this sofware/app to detect and monitor every individual process running inside my device system; what packet data (HEX) there are sending, where does it ended up, who is the receiver and also monitor suspicious process that is not suppose to be there.
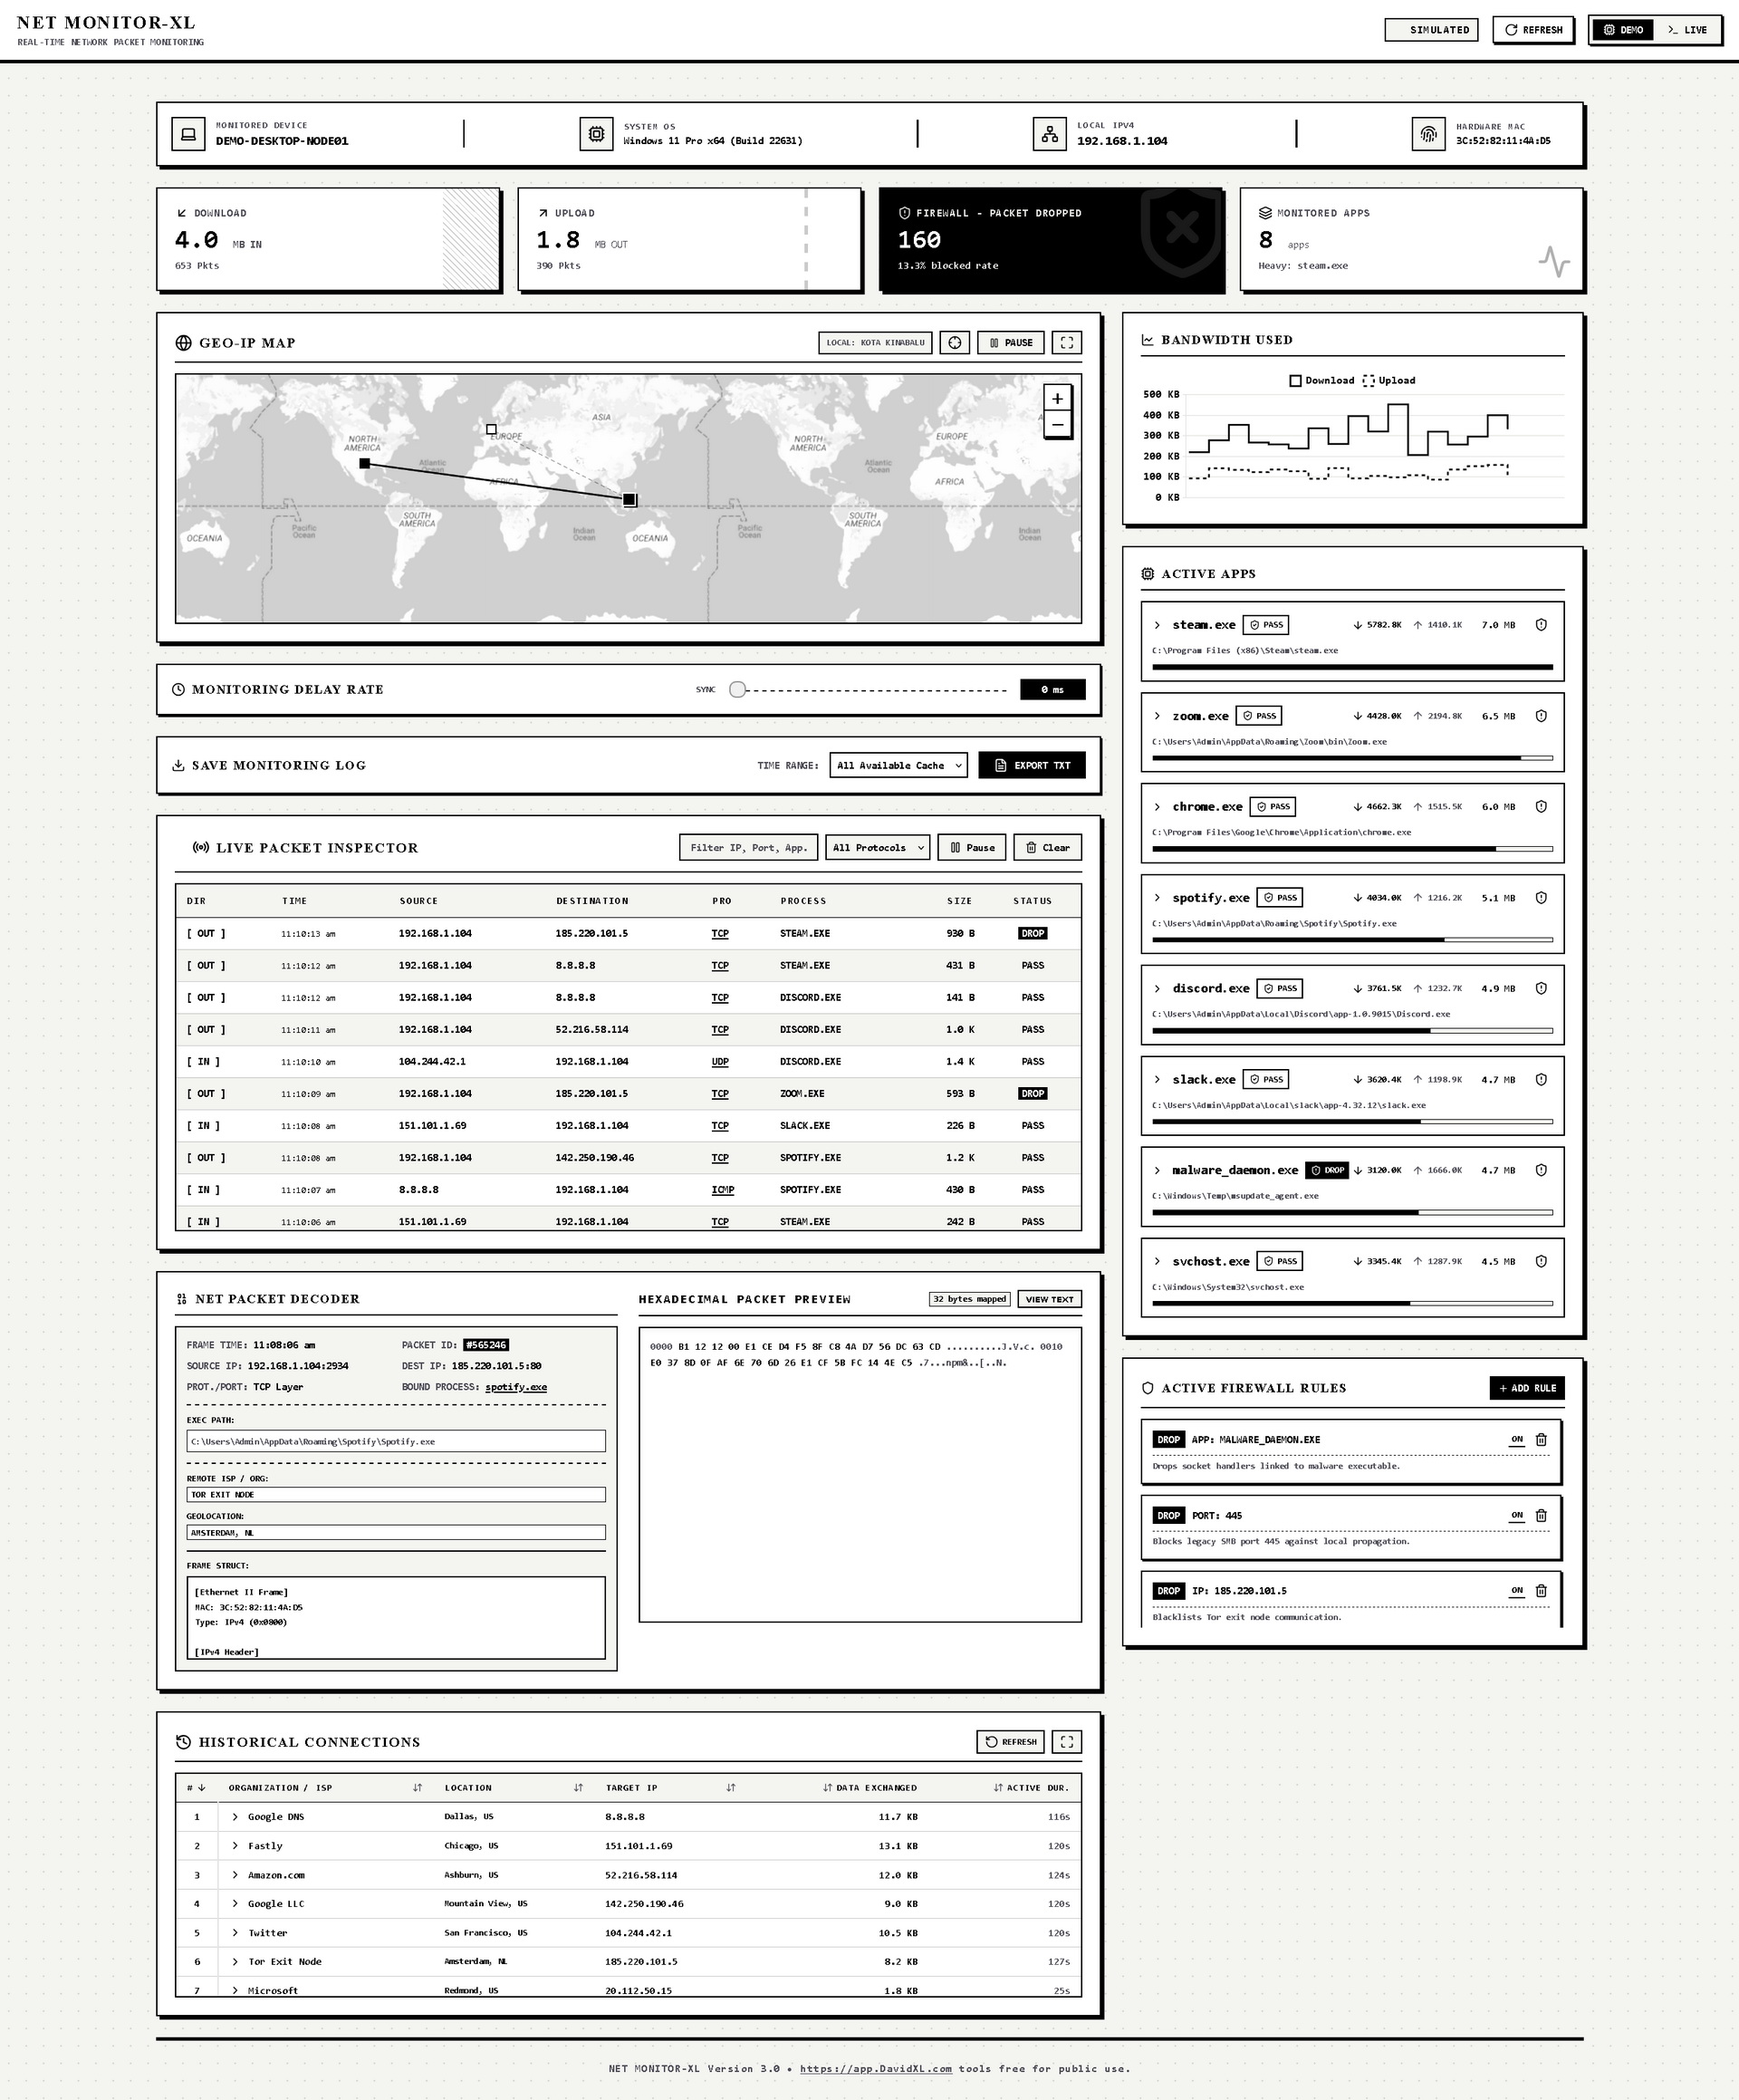
So here i am with my awesome app creation: NET MONITOR-XL is a real-time network telemetry, packet inspection, and firewall analysis tool. It is designed to provide users with deep visibility into the network traffic entering and leaving their machine, linking abstract network data directly to the specific applications generating it. Thankfully it help me a lot because one of my old laptop have so called 'Agent Smith' (pun intended..lol!) was running wild on its heatsink fan wheezing tornado huff and pufff! as soon i connected online....illegal process detected and eliminated. Yay!
Updates and bug fix log:
5/9/2026 - "HISTORY" panel have been refined with IN/OUTBOUND packet monitoring, fixed flickering data row and Export Session to TXT file features.
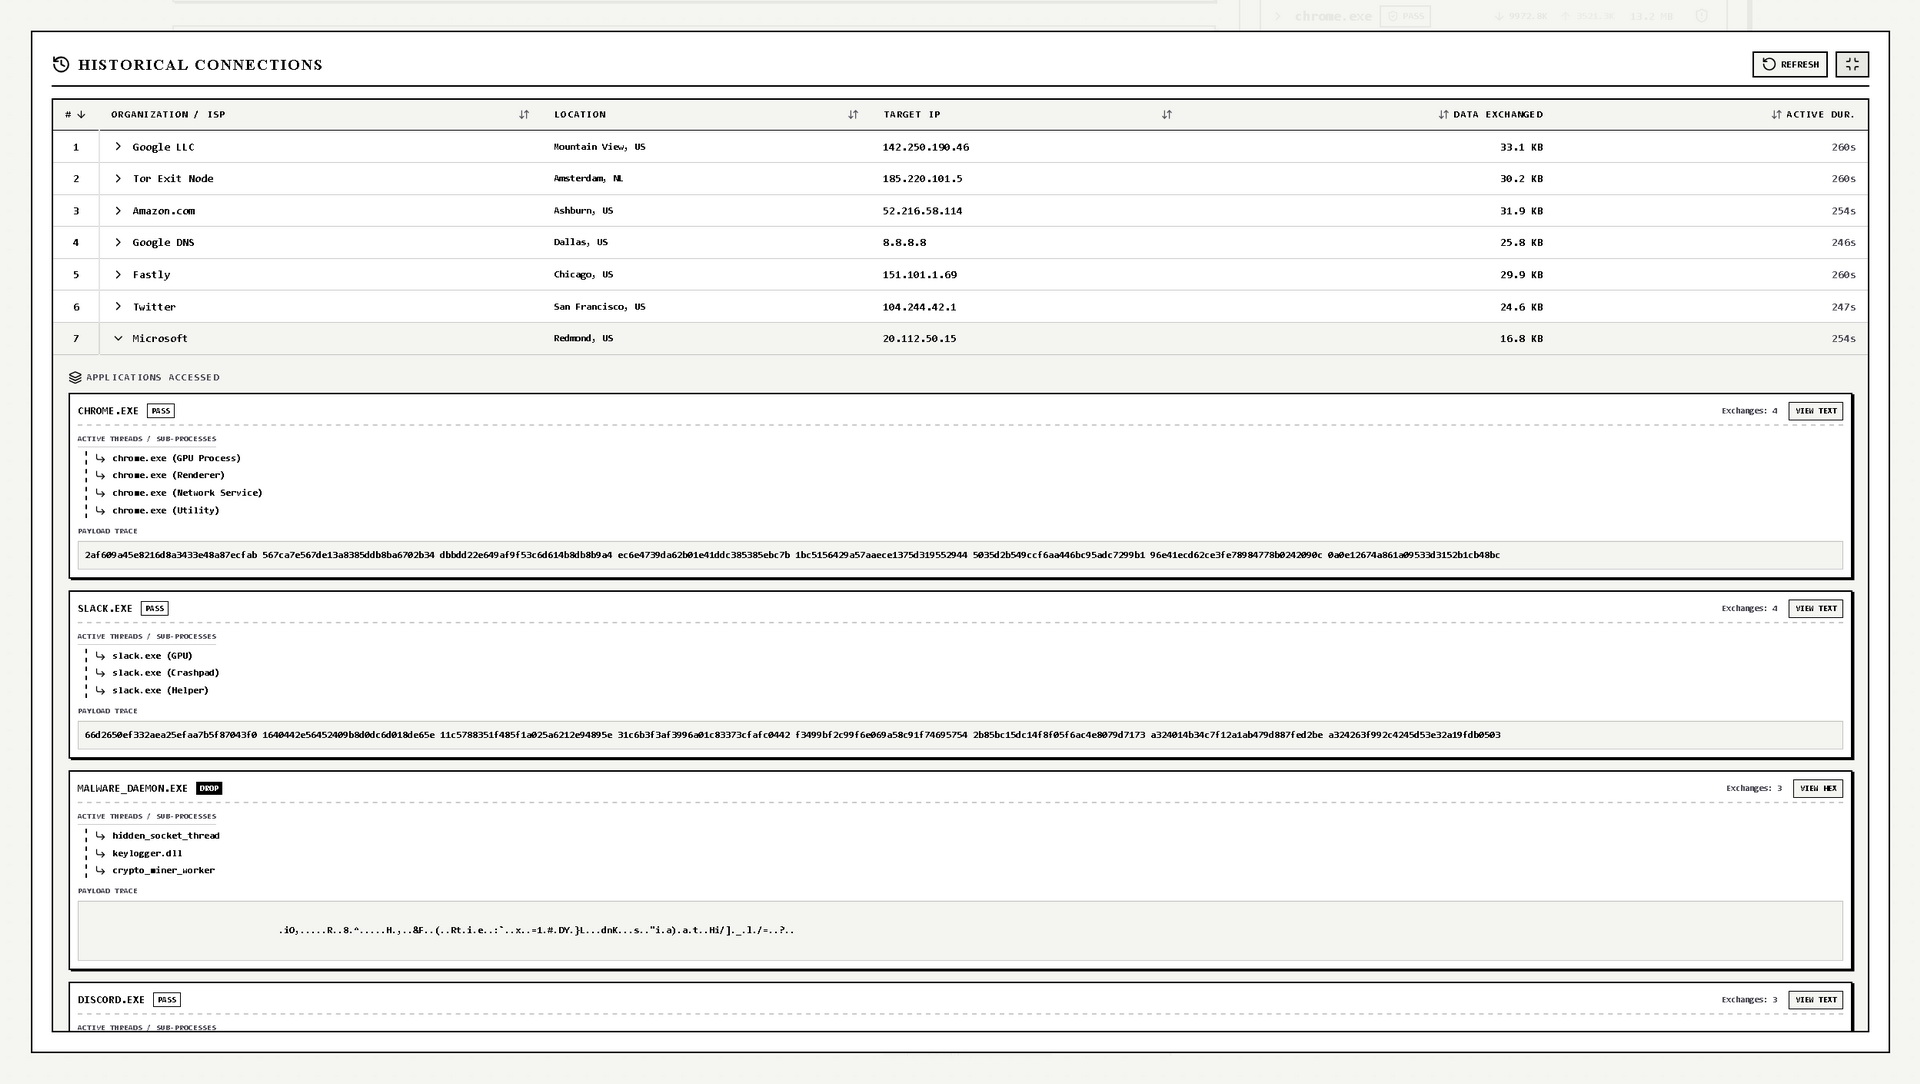
3/9/2026 - App upgraded to Version 3.0 with advance "HISTORICAL CONNECTIONS" panel to show detailed packet destination, linked process and also 'almost' text readable packet.
2/9/2026 - Add support instruction how to use on Mobile, SMART TV and other devices where Phython is not accessible.
29/8/2026 - GEO-IP MAP fixed, i use better map layout without ugly API request.
29/8/2026 - If you see "API KEY REQUIRED" on the GEO-IP MAP just ignore it.  No worries it works fine, just visually ugly as long you can see where the server marker located on the map already good enough.  I don't put API key for security reason.
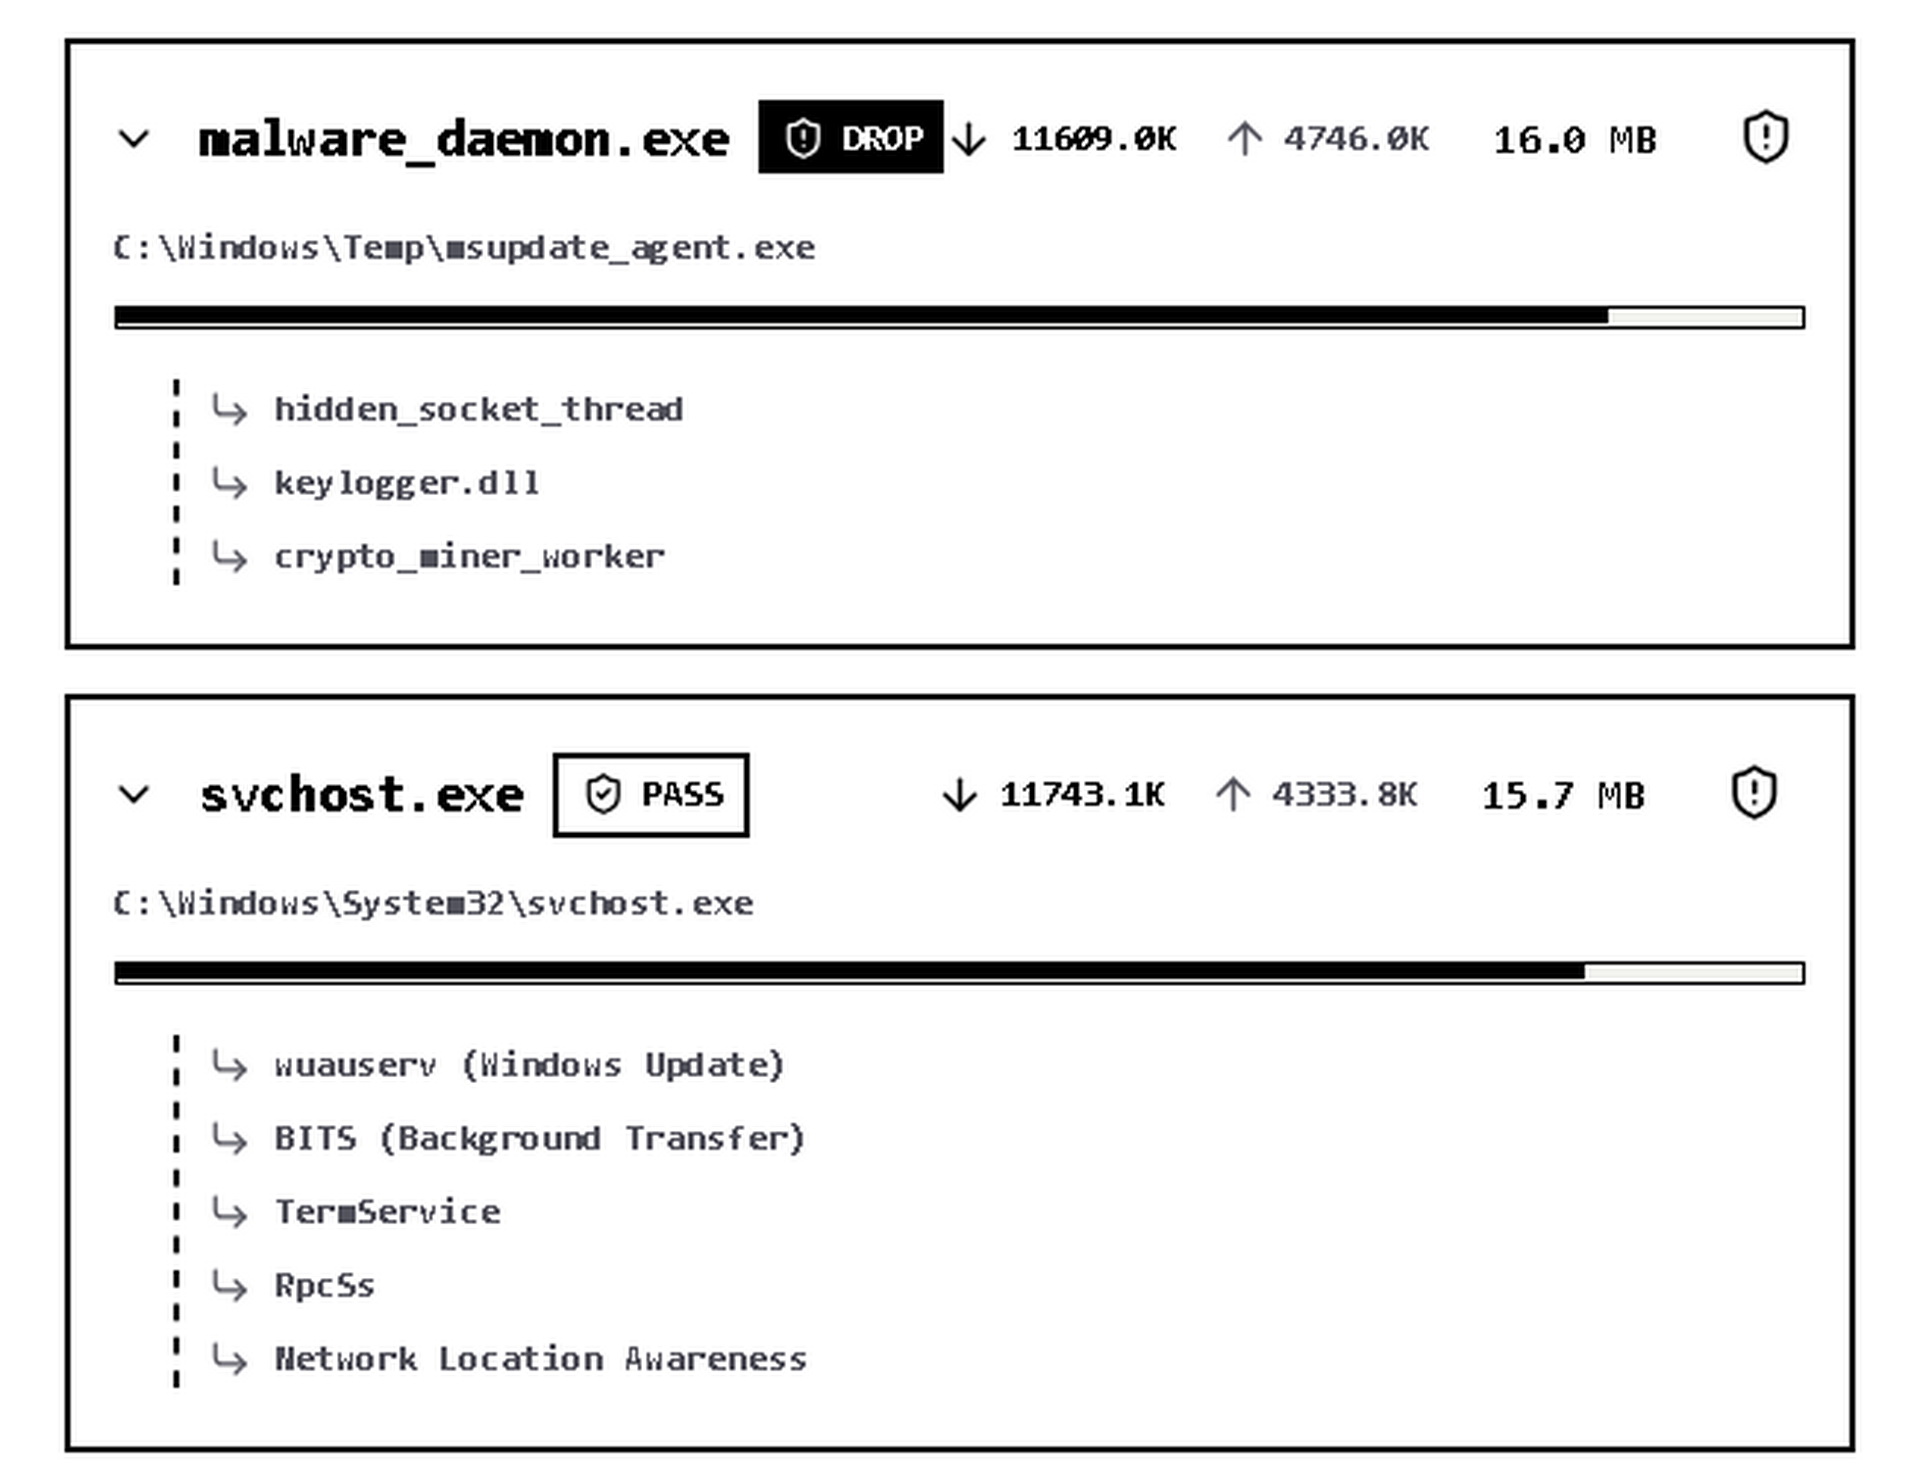
24/8/2026 - On "ACTIVE APPS" section now include an expandable accordion for each process when user click it reveal a hidden branch showing its underlying dependencies, sub-processes, or child services.
24/8/2026 - Fix GEO-IP MAP bug where now it can show GEOLOCATION of intercepted packet when go LIVE Agent connected .8/8/2026 - Add 'Npcap' requirement on the documentation. Read first before go 'LIVE'.8/8/2026 - Local Agent Connection code broken, fixed it.
How can it help you?
1. Real-Time Packet Sniffing & Inspection
The app captures live network traffic (TCP, UDP, ICMP, DNS) at the packet level. The Live Packet Inspector streams this data in real-time, allowing users to view the source, destination, protocol, and payload size of every connection. Users can pause the stream, filter by protocol or IP, and click on individual packets to decode their Ethernet/IPv4 headers and view a raw hexadecimal payload dump.
2. Process-to-Network Mapping (Active Apps)
Unlike basic packet sniffers, NET MONITOR-XL maps network connections directly to the running processes on the host machine. The Monitored Apps dashboard shows exactly which applications (e.g., chrome.exe, spotify.exe) are consuming bandwidth, displaying live upload/download metrics and the exact local file path of the executable.
3. Geo-IP Traffic Mapping
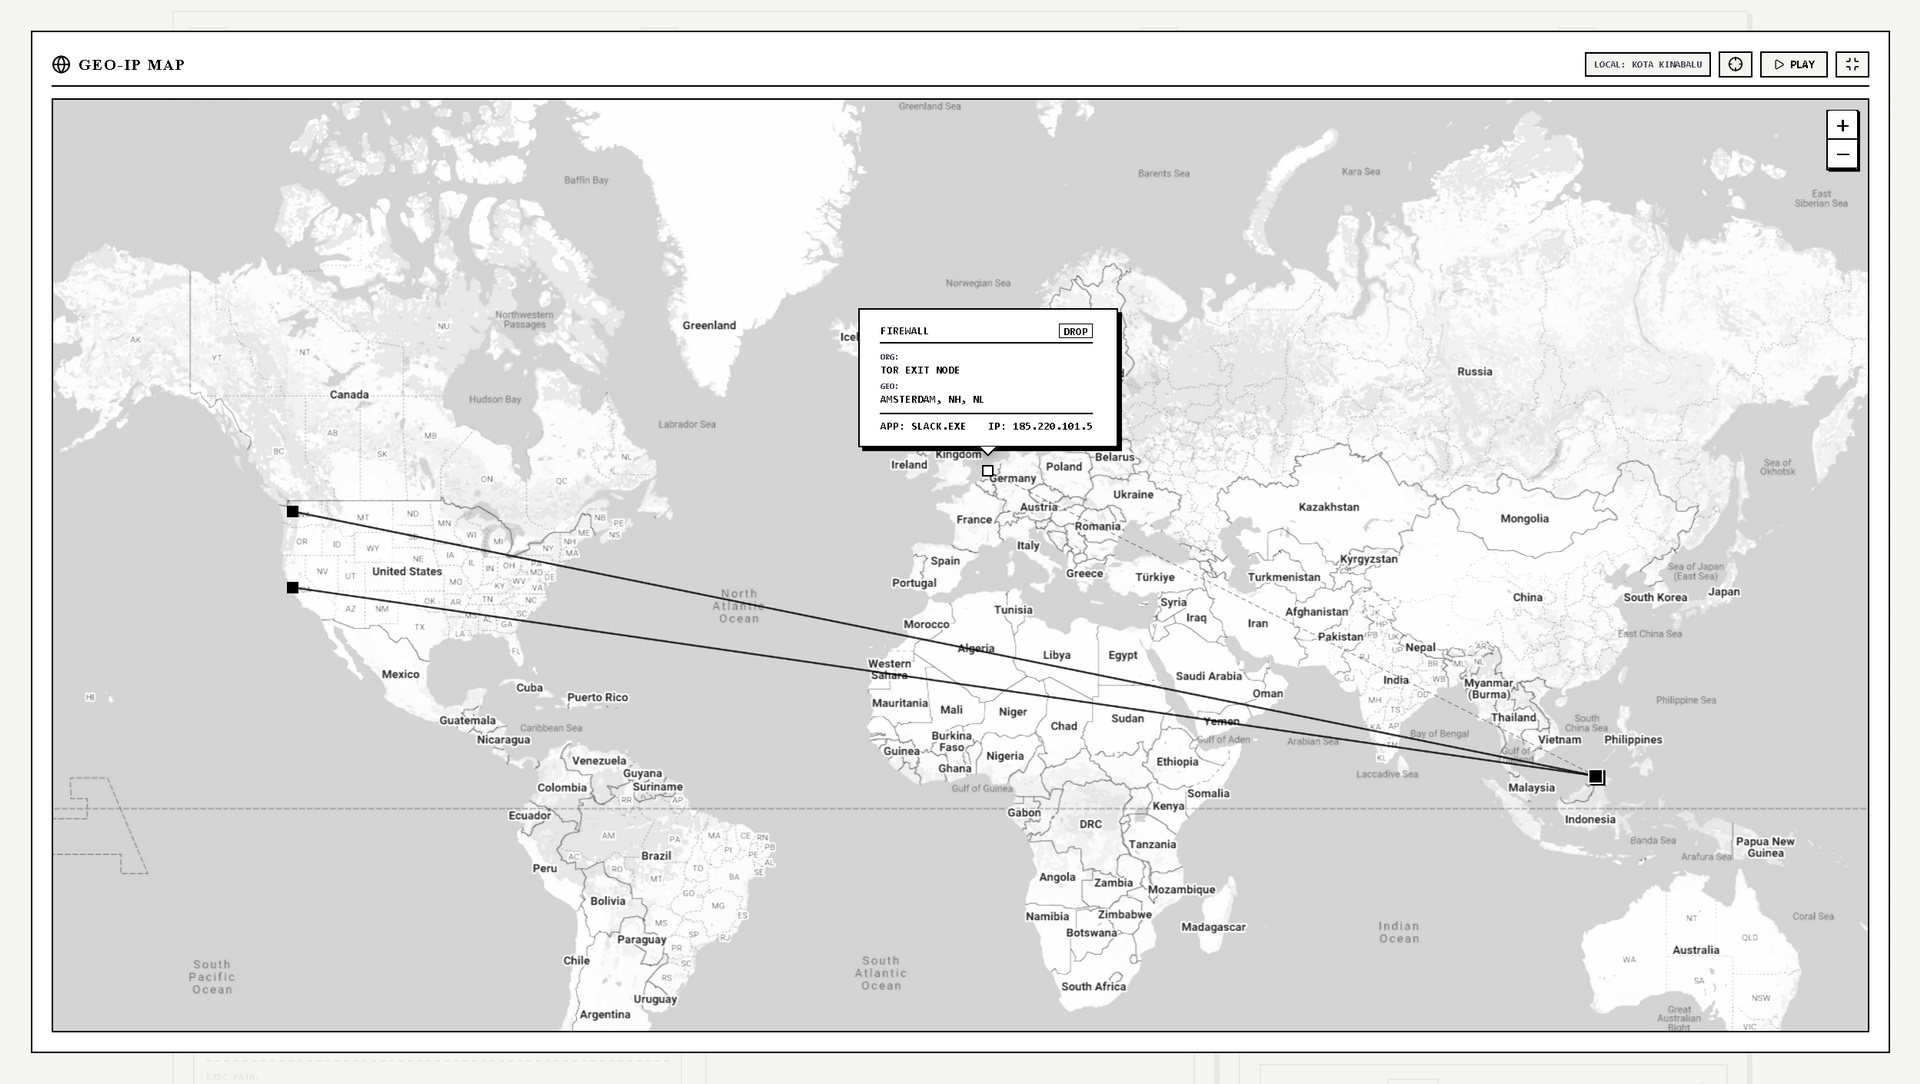
The application resolves external IP addresses to their geographical locations and internet service providers (ISPs) or organizations. This data is visualized on an interactive Geo-IP Map, drawing connection traces from the user's local gateway to global servers, making it easy to spot suspicious or unexpected offshore connections.
4. Interactive Firewall Rules
Users can enforce mock firewall rules directly from the interface. By adding rules targeting specific IP addresses, ports, or applications, the app will simulate "dropping" those packets. Blocked traffic is visually flagged in the UI, and the dashboard tracks the overall blocked packet rate.
5. Playback & Telemetry Control
To handle the overwhelming speed of modern network traffic, the app includes a Monitoring Delay Rate slider. This acts as a buffer, allowing users to artificially slow down the UI rendering of packets (in milliseconds) so human eyes can catch up and inspect rapid bursts of data.
6. Native Log Exporting
Users can snapshot their network cache and export a detailed .txt log file. This log includes timestamped packet data, application paths, and resolved geographical/ISP information, utilizing native Windows file dialogs for seamless saving.
How to use this app?:
How to Connect the "Live Agent" in NET PACKET MONITOR-XL
**Note: By default when you open the app it will run a mock/fake data for simulation/demo mode just to show you how it works. You need to click [ LIVE ] button to connect to your PC and monitor your network.....however you'll need to do few thing to get it work.
To view real-time network traffic on your computer, the "Net Packet Monitor-XL" web dashboard needs a local "Agent" to sniff the network packets and securely pass them to your browser. Here is the complete, step-by-step guide to getting connected.
Prerequisites
- Require Npcap is the official Windows packet capture library. In simple terms, it is a special driver that acts as a bridge between your computer's network card and your software. Go to the official website at npcap.com and download the latest free installer (e.g., Npcap 1.79 installer).
- You must have Python installed on your computer.
- If you don't have it, download and install it from python.org.
- Important for Windows users: During installation, make sure to check the box that says "Add Python to PATH".
Step 1: Open the Setup Modal
- Open the Net Monitor XL dashboard in your web browser.
- In the top-right corner of the header, click the LIVE button (next to the "DEMO" button).
- The "Live Agent Setup" modal will appear on your screen.
Step 2: Install Required Dependencies
The Python agent relies on specific libraries to read network traffic and communicate with the browser.
- Open your computer's terminal:
- Windows: Press the
Windows Key,typecmd, and press Enter. - Mac: Press
Cmd + Space, typeTerminal, and press Enter.
- Windows: Press the
- Copy the following command and paste it into your terminal, then press Enter:
pip install scapy psutil websockets - Wait a few moments for the installation to complete.
Step 3: Download the Agent Script
- On the "Live Agent Setup" modal in your browser, look for Step 2 ("Get The Agent Script").
- Click the DOWNLOAD .PY button.
- Save the
agent.pyfile to an easily accessible location on your computer, such as your Desktop or a dedicated folder.
Step 4: Run the Agent as an Administrator
CRITICAL: Because network packet sniffing is a low-level operation, the script will crash or fail if you do not run it with Administrator/Root privileges.
For Windows:
- Press the
Windows Key, typecmd. - Right-click on "Command Prompt" and select "Run as administrator".
- Navigate to the folder where you saved the script using the
cdcommand. For example:cdC:\Users\YourUsername\Desktop - Run the script:
python agent.py
For Mac / Linux:
- Open your Terminal.
- Navigate to the folder where you saved the script. For example:
cd ~/Desktop - Run the script using
sudo(you will be prompted to enter your computer password):sudo python3 agent.py
Success Check: Your terminal should output the following message:
Agent Initialized. Listening on ws://localhost:8765...
Step 5: Link the Dashboard
- Leave the terminal window open and running in the background.
- Return to the Net Monitor XL browser window.
- Look at Step 4 on the setup modal ("Link Dashboard").
- Ensure the input box contains exactly:
ws://localhost:8765 - Click the CONNECT button.
You are now LIVE!
The modal will close automatically, and a toast notification will say "LIVE PIPELINE ACTIVE".
- Look at the top-left of the header; the status should now say LIVE AGENT.
- The dashboard will reset its counters and begin displaying the actual network traffic entering and leaving your machine in real-time.
To disconnect: Simply close the terminal window running the script, or click the DISCONNECT button at the top right of the dashboard. At your Command Prompt/Terminal window; press key: CTRL + C on your keyboard to terminate the Python agent process to close that connection port on your local devices.
*Other devices: Using NET MONITOR-XL on Mobile & Smart TVs
Standard Android phones and Smart TVs do not allow you to install Python easily, and their operating systems strictly block the "packet sniffing" permissions required by the live agent.
However, you can still use the app in two different ways depending on what your goal is:
Scenario A: I want to view the dashboard on my TV/Phone (Monitoring my PC)
If you just want to use your large Smart TV or your phone as a "second monitor" to watch the traffic happening on your main computer, you can do this easily over your local Wi-Fi.
Step 1: Modify the Python Agent on your PC By default, the Python agent only allows connections from the same machine. You need to tell it to accept connections from your network.
- Open the downloaded
app_launcher.pyin a text editor (like Notepad). - Scroll to the very bottom, and find this line:
async with websockets.serve(handler, "localhost", 8765): - Change
"localhost"to"0.0.0.0"which means you'll have this new line:async with websockets.serve(handler, "0.0.0.0", 8765): - Save the file and run it on your PC.
Step 2: Connect your TV or Phone
- Open the
NET MONITOR-XL appon your TV or Phone's web browser. - Click LIVE.
- In the connection box, instead of
ws://localhost:8765, type in your PC's local IP address (e.g.,ws://192.168.1.104:8765). - Click CONNECT. Your TV/Phone will now stream live data from your PC!
Scenario B: I want to monitor the traffic of my TV/Phone
If you actually want to see what data your Smart TV or Android phone is sending to the internet, you have to use a "Man-in-the-Middle" hotspot method, since the agent cannot run on the phone itself.
Step 1: Create a PC Hotspot Turn on the "Mobile Hotspot" feature on your Windows PC (Settings > Network & Internet > Mobile hotspot).
Step 2: Connect the Device Connect your Android Phone or Smart TV to the Wi-Fi network being broadcasted by your PC.
Step 3: Run the Agent on your PC Run the app_launcher.py script on your PC, and open the dashboard.
*Important Limitation to Note: Because the Python agent is running on the PC and not on the phone/TV, it can intercept the packets and show you the Geolocation, IPs, and Map routes of the TV's traffic perfectly. However, it will not be able to tell you the specific App Name (e.g., it won't say "Netflix.apk" or "YouTube"), because it cannot read the TV's internal active process list. It will likely label these connections as "System" or unknown.
Scenario C: I want to monitor devices on my Wi-Fi Router (No Hotspot)
If you cannot use your PC as a hotspot and all devices are connected directly to your home Wi-Fi router, your PC cannot naturally see the TV's traffic because the router creates an isolated "tunnel" for every device. To force the TV's traffic through your PC so app_launcher.py can see it, you must use one of these advanced techniques:
Option 1: ARP Spoofing / Poisoning (Software) This is a network admin technique where you trick the router and the TV.
- You use a tool to tell the Wi-Fi Router:
"Hey, I am the Smart TV, send its data to me." - You tell the Smart TV:
"Hey, I am the Wi-Fi Router, send your internet requests to me." - Your PC sits in the middle, reading the packets and passing them along.
- How to do it: You would need to enable "IP Forwarding" in Windows (so the TV's internet doesn't just break) and run an ARP Spoofing tool like Bettercap, Ettercap, or a custom Scapy script targeting your TV's local IP address. Once the spoofing is active, your
app_launcher.pywill magically start seeing the TV's traffic.
Option 2: Port Mirroring (Hardware) If you are using a "Managed Switch" or a high-end enthusiast router (like Ubiquiti, pfSense, or OpenWrt), you can log into the router's admin panel and look for a feature called Port Mirroring or SPAN.
- How to do it: You configure the router to say:
"Take every single packet that goes to/from the Smart TV's IP address, and send a duplicate copy of it to the PC's IP address." - Your Python agent will immediately pick up these duplicated packets.
Scenario D: I want to monitor my phone, but my phone IS the Hotspot
When your phone is broadcasting the Wi-Fi hotspot, it acts as the "router." Because your PC is just a connected client, the PC's network adapter will only ever see traffic meant for the PC. It cannot naturally see the background traffic of the phone itself (e.g., your phone's apps syncing in the background).
To solve this, you have two options:
Option 1: The "USB Reverse" Method (Recommended)
- Connect your phone to your PC via a USB cable and enable USB Tethering to share the internet to the PC.
- Turn off the phone's Wi-Fi hotspot.
- Turn on your PC's Mobile Hotspot (follow Scenario B) and share the USB internet connection.
- Connect your phone's Wi-Fi to the PC's new hotspot. Now the PC is successfully in the middle!
Option 2: On-Device Packet Capture Apps Since the Python agent cannot run on Android/iOS, if you absolutely cannot use a PC hotspot, you will need to bypass the PC entirely and use a dedicated mobile app. Apps like PCAPdroid (Android) create a local VPN on the phone to intercept and read its own packets without needing root access.
*Important Limitation to Note for Scenarios B, C, & D: Because the Python agent is running on the PC and not on the phone/TV, it can intercept the packets and show you the Geolocation, IPs, and Map routes of the TV's traffic perfectly. However, it will not be able to tell you the specific App Name (e.g., it won't say "Netflix.apk" or "YouTube"), because it cannot read the TV's internal active process list. It will likely label these connections as "System" or unknown.